This article discusses the requirements and techniques for providing data to the SEM Dashboard from custom displays. If you are not already familiar with the SEM Dashboard, it is recommended that you read the relevant Getting Started guide to better understand how the Dashboard works before continuing.
Download the SSyM Dashboard module
The current release of the SSyM Dashboard module is 2021-11-16.
The SEM Dashboard allows administrators to quickly configure monitoring and alerting within their SEM environment. This is done by way of selecting a number of probes that should be measured on relevant agents; the Dashboard system then automatically runs the appropriate SEM displays on those agents to obtain the requested probe data, and then concentrates it into a central database for passive display or interrogation by users. In order for this to work, the various displays that gather information need to be extended to be ‘Dashboard-aware’; at a minimum, this means defining and implementing the Dashboard probes. The following sections describe the steps involved in extending a display to work with the Dashboard.
The features described in this article require the following component versions:
| SEM Component | Minimum Required Version |
|---|---|
| SEM Management Console | Build 8640 (of either version 2.3 or 3.0) |
| SSyM Dashboard | 20211011 (release date 11-Oct-2021) |
Before you start working with any displays, it is worth taking some time to consider which information will be most useful in the Dashboard. The following characteristics of a Dashboard probe are useful when deciding whether a given statistic is suitable for reporting:
Some probes may not naturally meet all these criteria, but can be made to fit into them when considered in the context of how alerting would be configured. For instance, one of the probes included with the Dashboard is ‘Prohibited Processes (Windows)’ - this is used to alert when a certain process name is active on a Windows agent, and works by matching the item name configured for the probe instance against the process list and reporting the number of running instances. Alerts can then be triggered if this number is greater than 0; in this way, the probe meets criteria 1, 3 and 4, and is actually monitoring to ensure criterion 2 is met!
Once you have decided which statistics you wish to report to the Dashboard, you can assemble the required information for defining the probe. This is described in the next section.
Probes are defined using a new SEM feature called Introspection, which was introduced in build 8549 of the SEM framework. Introspection allows a SEM display to include a number of Introspection Aspects, which describe aspects of the display that the rest of the SEM system might want to discover automatically - in this case, each probe a display can gather data for becomes one aspect defined in that display.
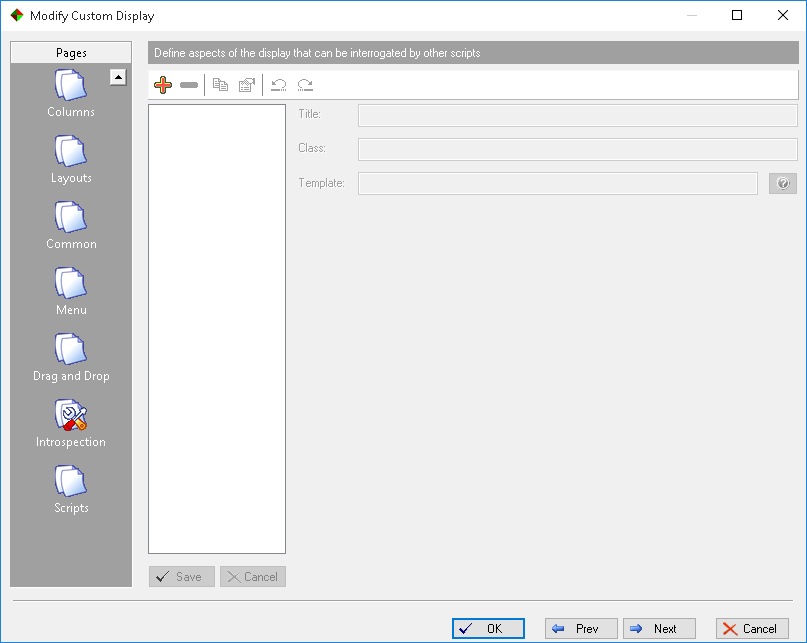
To define a probe, open the display in the Custom Display editor as usual, and select the Introspection page in the sidebar. That will display an editor pane such as the following:
Click on the Add button in the toolbar and choose Dashboard Probe when prompted to select an aspect template; this will add a new probe to the list of aspects on the left, and open it for editing in the table on the right:
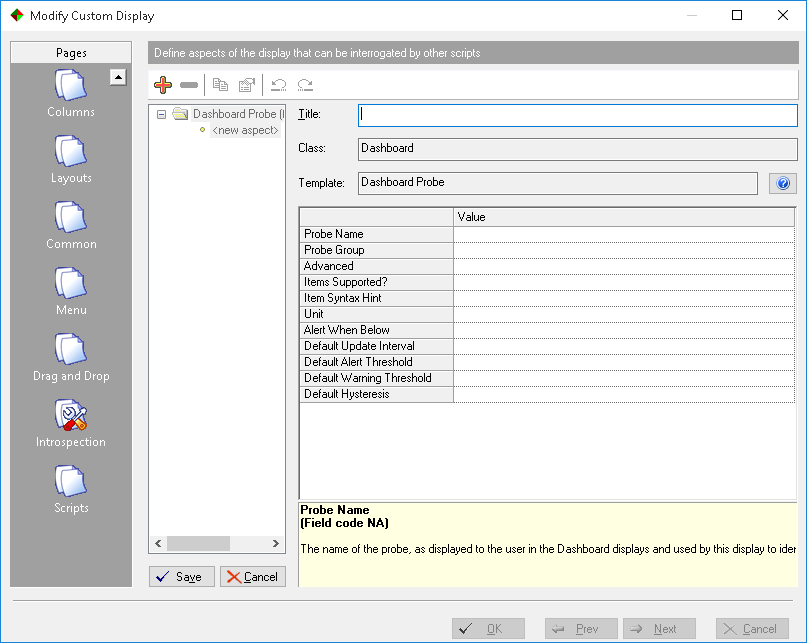
Fill in the details for the new probe; the editor pane provides information on each field as you move through them, but the fields required are as follows:
| Field | Description |
|---|---|
| Probe Name | The name of the probe, as displayed in the Dashboard and its wizards |
| Probe Group | The name of the group to show the probe under in the Dashboard |
| Advanced | Checked to indicate that the probe should be hidden from the Add New Monitoring Policy wizard by default, and only shown if advanced options are requested |
| Items Supported? | Checked to indicate that the probe represents a number of items on an agent rather than the state of the agent as a whole |
| Item Syntax Hint | A prompt string displayed to the user to indicate the format of item names for this probe (e.g. this might be ‘C:, / or DKA100:’ for a probe relating to disks) |
| Unit | The unit suffix to be displayed after a probe value (e.g. ‘MB’ or ‘ items’ - leading whitespace is supported) |
| Alert When Below | Checked to indicate that a lower value is worse for this probe |
| Default Update Interval | The default number of seconds between updates of this probe data |
| Default Alert Threshold | The default value above/below which the probe should be considered in Alert state |
| Default Warning Threshold | The default value above/below which the probe should be considered in Warning state |
| Default Hysteresis | The default amount the probe needs to move back away from the alert/warning thresholds to drop back to a less-severe state; this is used to avoid an oscillating value that straddles a threshold causing duplicate alerts |
The four 'default' parameters should be chosen to be sensible starting points for a new monitoring policy, but can be overridden as required by the user once they start to configure instances of the probe. The other parameters cannot be overridden by the user as they are considered intrinsic to the definition of the probe itself.
Once the form has been completed, click Save to store the definition. If you have multiple probes to define, you can either repeat the process by following the above steps again, or alternatively using the Batch Add… button in the template selection list to create several aspects from the same template in one go. Using this option will allow you to provide a list of probe names; these bulk-created aspects can then be edited individually to provide the rest of the probe details as required.
To provide data to the Dashboard, the post-processing script of the relevant displays needs to be extended to gather the correct information and pass it to a routine defined in the Dashboard Integration Class. To simplify this process, the Dashboard provides an include file called Dashboard_Update; this include file defines a number of Perl subroutines, with the most important of these also being called Dashboard_Update.
The Dashboard_Update subroutine expects the following parameters:
The simplest example of using Dashboard_Update can be found in the CPU Top Processes display. This display reports a single probe value - CPU Usage in percent - for each agent; since it has to calculate this differently for each supported agent platform, a global $dash_value variable is set in each platform-specific section of the post-processing script. After all processing is completed, the following code sends the calculated value to the Dashboard:
#include Dashboard_Update
if ($LOOP_COUNTER > 0 && Dashboard_Enabled)
{
Dashboard_Update($server_name,
"CPU Top Processes",
["CPU Usage"],
"" => [$dash_value] );
}
The main points to note here are the parameters to Dashboard_Update - the agent name taken from a variable provided to the script by the SEM framework, the display name, the list of probe names (containing just the one entry, “CPU Usage”), and finally the data hash. This hash has one key (the empty string, representing the agent as a whole) and its associated value (a list of probe values, again containing just the one CPU usage figure).
In addition, notice that the Dashboard_Update call is guarded by a conditional which checks both that the display is running in a Dashboard context (the Dashboard_Enabled condition) and that it has valid data to return ($LOOP_COUNTER is greater than zero; it’s only on the second and subsequent cycles of the display that the display can calculate CPU usage over the elapsed interval).
To illustrate a more complex scenario, consider the following code taken from the Dashboard-compatible version of SSyM’s Disk Usage display:
#
# Dashboard support
#
#include Dashboard_Update
my %dash_data = ();
my $dash_pcused, $dash_mbfree, $dash_device = "";# ... omitted for brevity ...
foreach $line (@input_array)
{
my $prefix = substr($line,0,5);#
# Gather statistics for the Dashboard
# (% Used is stored when calculated below)
#
if ($prefix eq "DV : ")
{
$dash_device = substr($line,5);
}
elsif ($prefix eq "FM : ")
{
$dash_mbfree = substr($line, 5);
}
elsif ($line eq "@" && $dash_device ne "")
{
$dash_data{$dash_device} = [ $dash_pcused, $dash_mbfree ];
$dash_device = "";
}# ... omitted for brevity ...
$pc = sprintf "%d", 0.99999 + (($used * 100) / $size);
$fp = 100 - $pc;$dash_pcused = $pc;
# ... omitted for brevity ...
}Dashboard_Update($server_name, "Disk Usage", ["Percentage Used", "Free Space"], %dash_data);
Here we can see that some data values are pulled directly from the display data ($dash_device and $dash_mbfree), and another is taken from a calculation that was already being performed ($dash_pcused). These values are remembered as the post-processing script works through the agent output, and stored in the %dash_data hash (keyed by $dash_device) once the end of each display row is found (the ‘$line eq "@"‘ conditional). Once the entire input array has been processed, the collected data is handed directly to Dashboard_Update; notice that this time the list passed as the third parameter contains two probe names, corresponding to the list consisting of the $dash_pcused and $dash_mbfree values that was previously stored in each hash entry.
For displays that may need to perform more complex operations on the data before sending it to the Dashboard, it may be useful to make use of the other routines defined in the Dashboard_Update include file. We have already seen Dashboard_Enabled used to check whether a display is running in order to obtain Dashboard data or not; if finer-grained information is required, for instance to avoid particularly expensive processing for some probes that isn’t required for others, the following additional routines are available:
Dashboard_AllRequiredProbes returns a list of probe names that the Dashboard wants the display to gather data forDashboard_AgentsWithProbes returns a list of agents that the Dashboard wants the display to gather data from (although this will currently be identical to the list of selected agents for the display, this call is provided in case this assumption changes in future versions)Dashboard_ProbesForAgent($agent_name) returns a list of probes that the Dashboard wants the display to gather data from the specified agent forDashboard_ItemsForProbe($agent_name, $probe_name) returns a list of items on the given agent that the Dashboard wants to gather the specified probe data forThe last of these routines is particularly useful where a display may return data for a lot of items but only a few of them are likely to be of interest to the Dashboard. An example of this is the Windows Processes display, which supports the ‘Required Processes’ and ‘Prohibited Processes’ probes; these probes both need to be configured with a process name, and the display uses the Dashboard_ItemsForProbe routine to provide the Dashboard with a count of instances of each configured process name.
Once you’ve defined the relevant Introspection Aspects for your probes and implemented the necessary code to gather the corresponding data, your Dashboard installation will need to be refreshed so that it can discover the new probe definitions. This is done using the Maintenance -> Update Available Probe List menu item in the main Dashboard display; selecting it will display the following form:
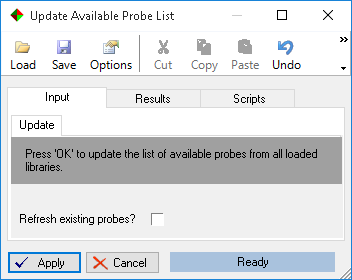
The ‘refresh existing probes’ option should be selected if you have made changes to any Introspection Aspects that were previously registered with the Dashboard; it makes sure that the probe details held in the Dashboard database match those defined in any loaded displays. If you don’t select this option, only probes that did not previously exist will be copied into the Dashboard database; this can be quicker when you know that only new probes have been added.
After clicking OK, the operation will return statistics regarding how many new probes were discovered and how many existing ones were refreshed, if applicable. You can now close the menu window and use the Add New Monitoring Policy wizard to create monitoring policies that use your new probes. Bear in mind, though, that the SEM Service Displays service responsible for running the Dashboard monitoring displays will need to be restarted in order to load your updated displays before the probes will operate!
The easiest way to test your new probes is just to create a monitoring policy and wait for the new statistics to show up in the Dashboard display; this should only take a few moments (assuming the SEM Service Displays service has been restarted since the last change to your displays).
When developing new probes, however, especially in more complex displays, you may find you need to test and debug your code in a running SEM environment rather than as a ‘black box’ background process. Unfortunately the Dashboard does not currently offer an easy way to isolate certain displays for this purpose; if you were to start the Dashboard Central Controller display manually, it will probably go into its ‘standby’ mode where it does nothing except monitor the status of the background process. Once you stop that background process the interactive session will take over - but it will promptly launch every display required to handle your monitoring configuration, not just the ones you want to work with!
The two approaches currently available to deal with this situation are:
We acknowledge that this is a shortcoming of the current release of the Dashboard environment, and are working on improving the development and testing experience for a future update!
If you can't find an answer to your question in our knowledge base, please feel free to contact our support team.
Find answers to common support questions in our Knowledge Base.
If you require support with an issue not listed here, or have any other enquiries, please contact us.
© Sysgem AG, all rights reserved.
Sysgem is a trademark of Sysgem AG. Other brands and products are registered trademarks of their respective holders.
Sysgem AG, Forsterstrasse 67, CH-8044 Zurich, Switzerland
+41 44 586 1060